
From the previous article you learned what conversion attribution modelling is and why it is important to see beyond the last-click data. Now let’s talk about the models themselves – how they work, what is our approach to building custom models and why it is better than what you get from Google Analytics reports.
Again, attribution modelling is all about defining which traffic sources (we call them “channels” and “subchannels”) are the most important during customers’ paths. Which of those are necessary to make a user become the customer and which are obsolete.
Let us use the following metaphor: there are 3 players in a team-based game. They are on different levels and their responsibility and duties vary. However, together, as a team they are responsible for the win. Does it mean that the prize shall be distributed even-handedly? If not, then are the weaker players redundant in the team? Similarly – if we have a conversion that happened after few sessions, each of which came from a different traffic source, how to decide what traffic source was the most important?
The answers to those questions were provided by the two guys at the beginning of 20th century – Andrey Markov and Lloyd Shapley. They both worked on such problems and designed mathematical solutions for finding what is the real value of every element in any complex system. In details, their works differ much, but they can be used for attributing conversion by data-driven models.
How does it work? Lloyd Shapley introduced something called a Shapley Value – that is the formula for calculating the gain, that each element provides to the whole system – in our case a set of traffic sources. Markov in turn, focused on series of events – chains and proposed a theory that the value of each element in chain can be calculated basing on combining all paths to a single chain and calculating what is the probability that one state will lead to another.
Let’s consider the following situation:
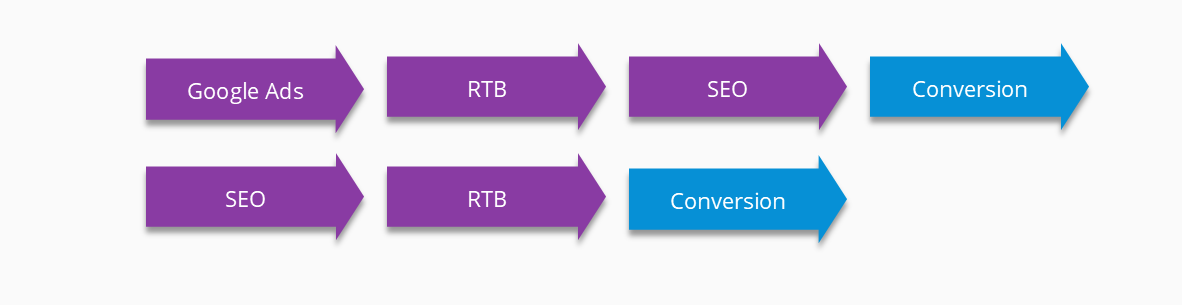
We have two paths that ended with a conversion. These two paths can be transformed into such a chain, and for each traffic source we can calculate the probability of the next traffic source or event that may occur – in that case, conversion.
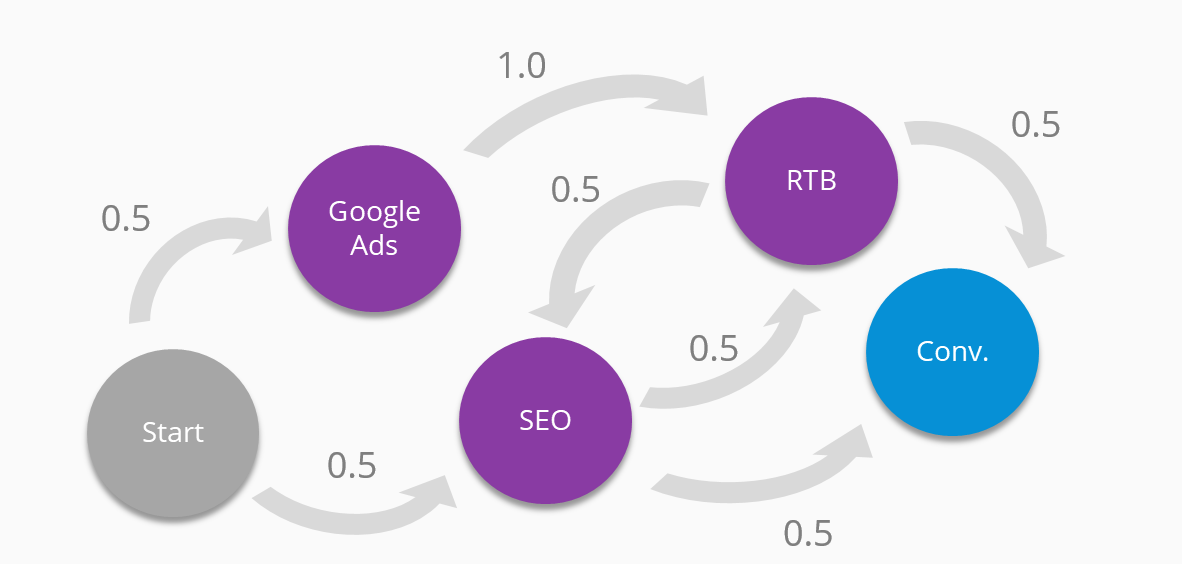
Then, by summing the probabilities on paths to conversion we can calculate the importance of each element. In this case Google Ads gets credit for 0.5 conversions, RTB for 0.75 and SEO for 0.75.
What is worth mentioning, every case needs an individual approach. Especially with regards to model settings such as the choice of path lengths (if you wish to know more about custom approach, go to the next article). Nevertheless, the effect of the data-driven model is the same – each traffic source gets the amount of conversions it deserves and you have the access to unbiased data, that include all sessions on user paths, and usually the data-driven attribution models show different figures than the traditional Last Click approach.
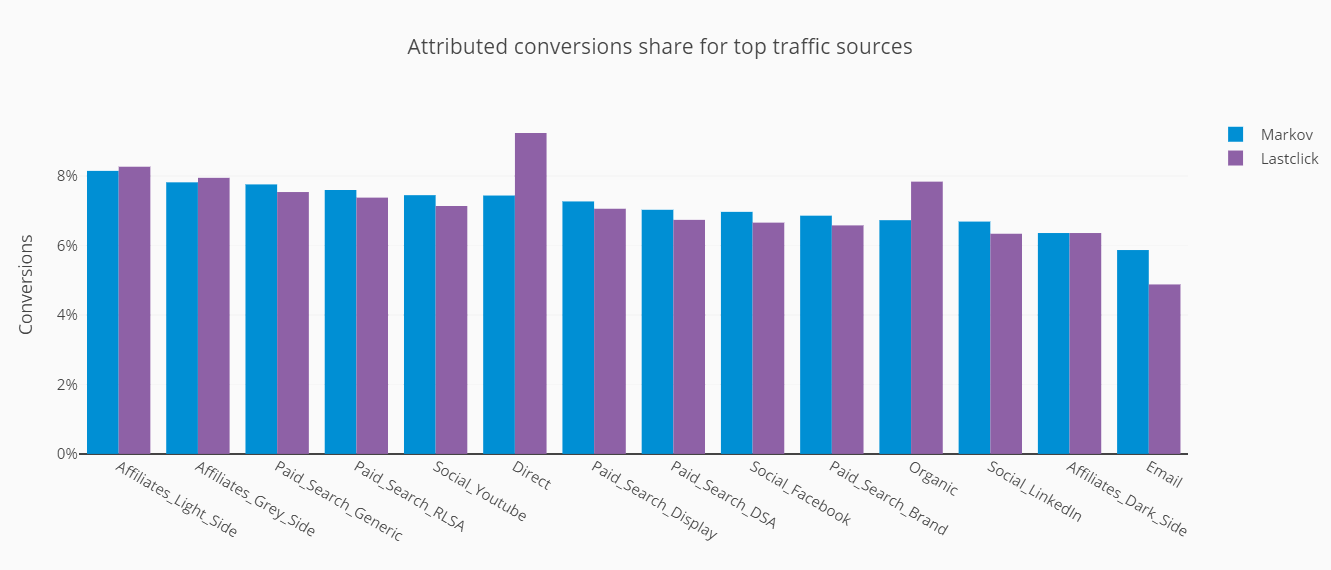
Most often, the data-driven attribution gives more credit to sources that start user paths – such as prospecting or search, and diminishes those that are the pushiest – like affiliates and aggressive performance.Do you want to learn more? Please, see the next article about individual approach to each project.